
Before we start a huge shout out to our UK Wildcat football team. I was fortunate enough to be at the Citrus Bowl with my soon to be graduating from UK daughter and it was an amazing experience to share with her. To Coach Stoops and those young men, THANK YOU!
If you’ve watched enough of our regular broadcasts, been at weather talk given to a civic group, or even been a part of a Bill’s Weather 101 we always talk about cycles and balance. It’s the very basics of why most everything in weather happens…to keep a balance. THE source for all weather is the Sun, which unfortunately (or fortunately if your bread and butter is changing weather) does not heat the Earth evenly. There’s much more heat at the Equator than the Poles. A large body of water heats and cools more slowly than a nearby landmass or on a small scale different land uses and types heat differently.
Nature is ALWAYS trying to correct these imbalances. Gigantic chunks of air we call air masses (represented by the highs on a weather map) are created. The cold ones from the polar regions, warm ones from the tropics or temperate zones are always moving toward their opposites to try and correct the imbalances. Nature’s mechanism to makes these occur are the low pressure systems and fronts that we portray on a weather map. The boundary is essentially the Jet Stream. When you look on large scales, continentally or even globally, for every spot that is warmer, colder, wetter or drier than normal there will be a equivalent opposite of it somewhere on the globe. On our continental scale, usually if the west side of the continent, and it can go all the way to Alaska, is warm, then our side of the continet will be cold.

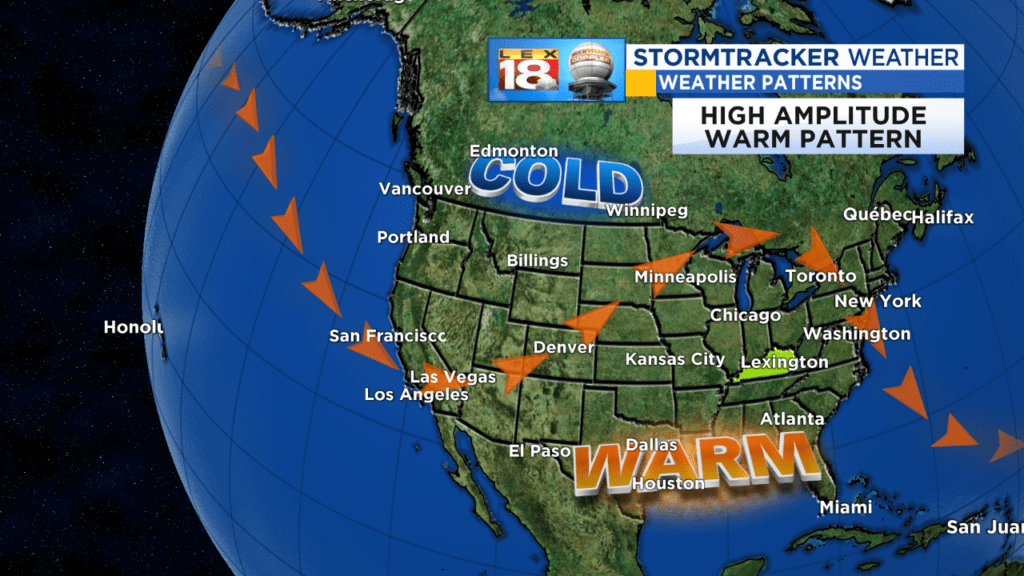
The example shown above is what we call a positive PNA pattern. The amplitude (or height) of the jet stream can vary with the more extreme leading to much colder than normal patterns and flatter look leading to more of a normal cool feel. WIth this depiction, warm air heads up the west side of the continent toward the North Pole. Consequently that cold air must be displaced to keep the balance and it’s shunted down the east side of the continent and into our area. In the more extreme examples the flow can actually go into Asia and tap Siberian air with a cross polar flow. When we get cold, Alaska gets warm (when compared to normals) and vice versa.
The opposite also holds true. When we get warm, in general the west side of the continent is colder than normal (heck in snowed in Vegas a few days ago).
Sometimes these warm ridges are something special and amplified and we can end up with temperatures radically out of season like we saw in early October. Other times the ridge is more subtle and we’re just delightfully mild.
So now that we’ve established a basic floor of knowledge here, why bring this up now? We’ve been enjoying a very easy start to the true (or even meteorological) winter season with temperatures averaging well above normal and snow is basically non-existent for us. In fact it’s been that way over most of the central and east (with a few exceptions) for a while. That may be due (and is likely) to change here shortly and it all comes back to our basic premise here today, CYCLES.
This is a plot of our daily highs and lows for 2018 imposed over normal range of temperatures for the year (in green) that makes a lovely bell curve.

This comes from the Midwest Regional Climate Center located at the University of Illinois and there are a couple of things that stand out. First you can see on the ends, which represent the winter season, the range of daily temperatures is more extreme than the summer. Because of where we are on the globe we are subject to wilder fluctuations of temperature as we can come under the influence of both extreme cold and warm air masses relative to season during the cold months. There’s much less variation in our warm season in the middle.
What also stands out is there are jumps, sudden changes, where we go from the warm patterns to cold (or vice versa). Some are stark like on the left side where we went from extreme warm to a prolonged below normal period (remember last year’s spring that wasn’t). You can also see something similar on the right side where we went from prolonged well above at the end of summer into fall and then the bottom dropped out the second week of October (last year’s fall that wasn’t).
When you look at the graph, there are CYCLES. So we went ahead and did the next step and tabulated the dates out. (You can do that on the MWRCC web site). What was remarkably interesting and fascinating was the regularity of this overall pattern of change and the sub patterns within it.
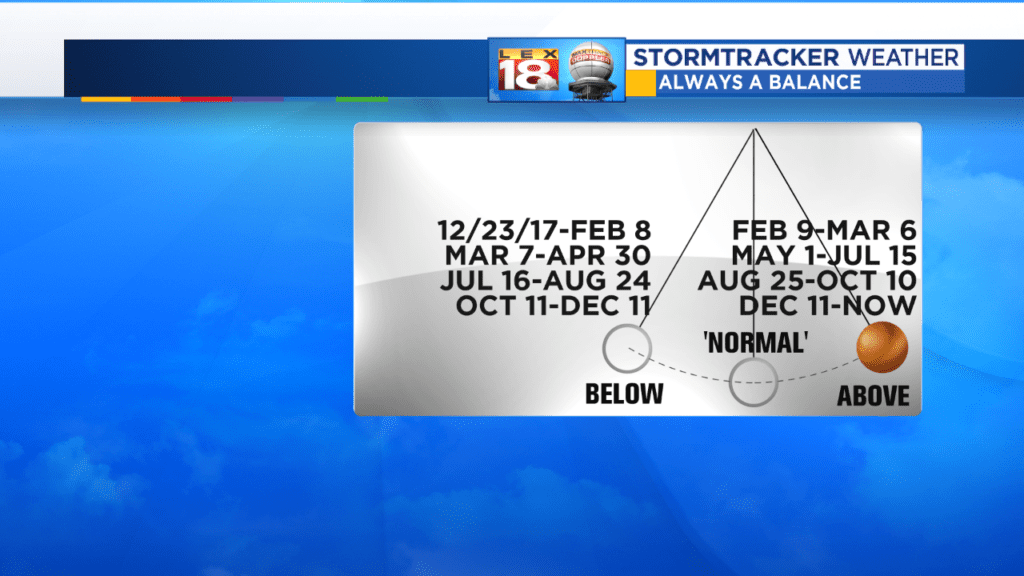
These are the dates of the overall patterns and the times they shifted. Now within each group it’s not completely monolithic…within the overall cold periods there were short warm or near normal spells and vice versa. However, the overall character of the weather regimes verifies pretty well with the graph above.
So, what do we take from this? That each of these sub patterns within this big swinging of extreme temperature pattern lasts on average about 6 weeks. A few were closer to a month, a few closer to 2 months, but overall it’s about a 6 week average. That is, roughly 6 weeks above followed by 6 below, lather, rinse and repeat. By the way, some of those were epic…the cold that started the year and the heat of late September and October. The switch that was flipped on October 11 from warm to cold was amazing.
Anyway,this current pattern is getting to its 1 month birthday and there are some signs showing up that changes are coming. We have some actual days of below normal next week. Nothing dramatic, but kind of the first chink in the armor. Also remember, we had a full bore cross polar cold weather pattern in November. Winter hit hard and early over most of the central and eastern US (and Canada had record snow cover). That pattern lasted until the 11th of December and since then winter has left our part of the world.
Well if cycles repeat (and I think we’ve just demonstrated they do), when this shifts back in the next week or 2 (and it should), instead of a November version of a cold pattern, we get a mid January version and the end results are quite different. They may still be 20 degrees below normal, but 20 below normal in mid November is much different that 20 below normal in January.
Also, most of our shifts have not been subtle, the pattern and current cycles are toward the extremes, so when this change does come, those that have been emailing, facebooking and tweeting that they want some ‘real winter’ may get exactly what they wished for, and then some. It’s just like a pendulum, swing it wide, it comes back wide. Swing it a little, and it just comes back a little.
So enjoy this relatively warm January weekend when we’ll be running 7 to 15 degrees or so above normal with temperatures more like late November making up for the January temperatures we had in November…ahh balance! The pendulum is likely to swing again soon.
All the best
Bill
